Formatting tabular reports
Learn how to:
Change general table formatting
Perform from the Column or Column Heading
Group rows based on attributes (Break By)
Formatting data in a Visualizer table
Change general table formatting
- To change
table formatting, click table formatting
 in the toolbar.
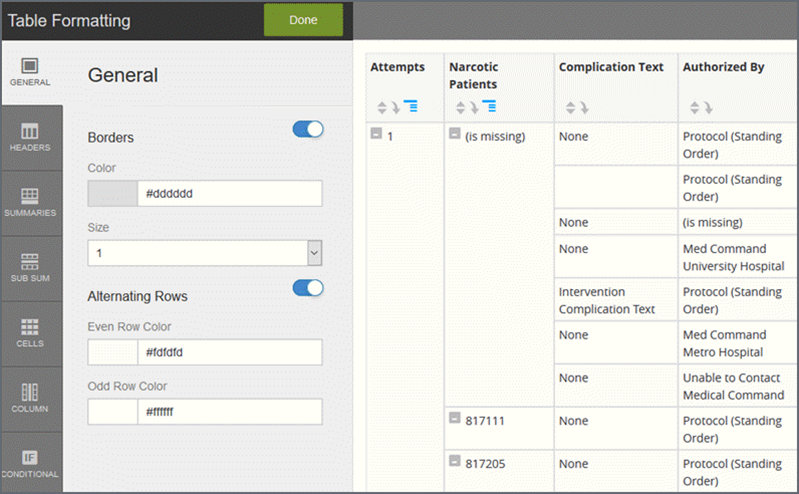
- As you select options, Visualizer previews
the changes. Options include:
- Border on/off toggle, color and size
- Alternating rows on/off toggle, row colors
- Header background color
- Header text font, color, background color, size, style
- Summary background color
- Summary text font, color, background color, size, style
- Sub Summary background color
- Sub Summary text font, color, background color, size, style
- Cell text font, color, background color, size, style
- Per-column formatting, either the whole column or sections (header, summary, sub summary, cells)
- Conditional formatting, see Conditional Formatting for Tables and Crosstabs
- Click Done.
- To specify
the number of decimal places or add a currency symbol for measure, click
the measure in Columns
and select the DataFormatting
option.
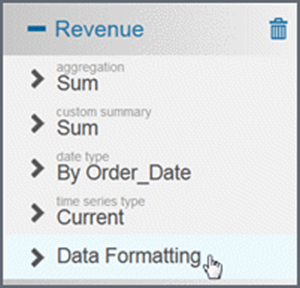
- Click Save.
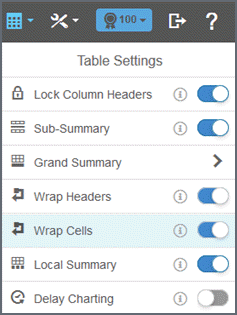
Perform from table settings
Show/hide the Grand Summary
By default, the Grand Summary displays at the bottom of the measure column.
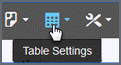
- To toggle this option on/off, click TableSettings.
- Click GrandSummary
and then slide the toggle
on or off for either/both the column or row.
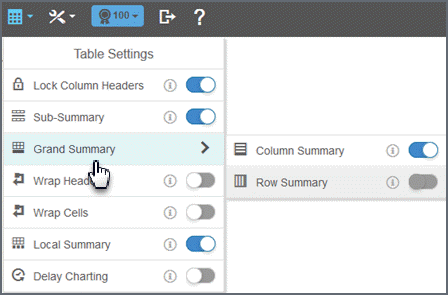
- To change the defaultautosummary for a measure column, click the downarrow in the columnheading and select GrandTotal.
Wrap headers and cells
Table Setting warp options apply to entire tables or crosstabs.
For long headers, toggle TableSettings > WrapHeaders.
For cells, toggle TableSettings > WrapCells.
Perform from the Column or Column Heading
Change a label
To change a column label:
- Double-click the column.
- Enter the new value.
- Click the checkmark.
Change a column width
The default column width is 95 pixels. The shortest width is 40 pixels.
Resize width by dragging the columnedit in the header.
When the column is narrow, the table sorting option moves into the column formatting drop-down menu.
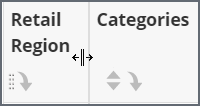
Reorder column
Reorder the column by hovering in the header to reveal the reorder button. The pointer changes, and you can now drag the column to another location. A blue bounding box shows the new location of the column.
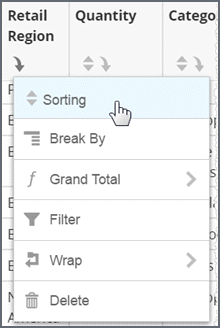
Sort the column data
Sort the data in the column by clicking the sort icon ![]() in the column header.
in the column header.
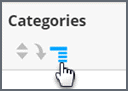
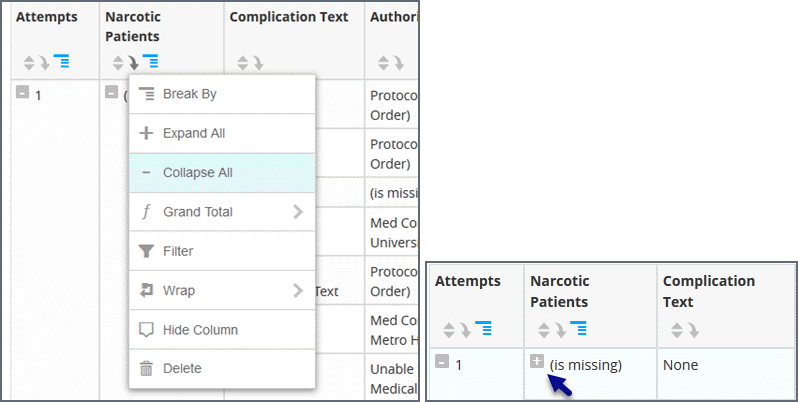
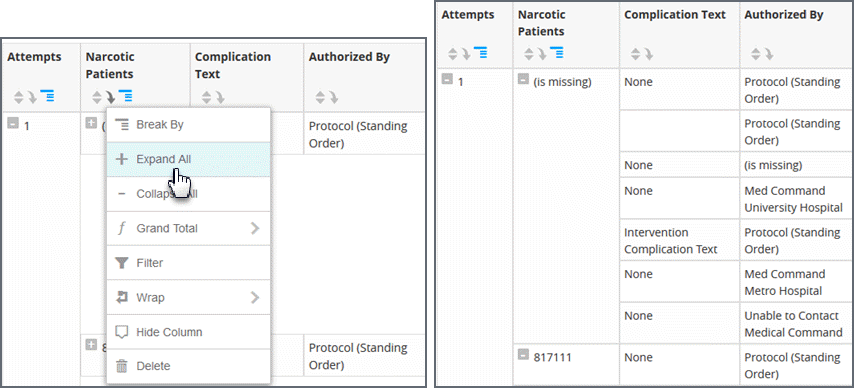
Group rows based on attributes (Break By)
To group the table rows based on attributes and view summaries for each group in a column, click the column menu in the header and select Break By.
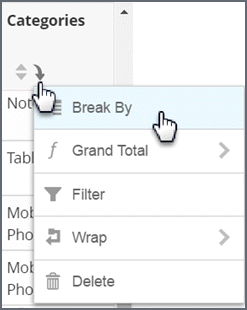
Break By adds expand/collapse button and sub-summaries for each break. Click the hashmark by the category to collapse or expand the results in the table.
Collapse and expand all Break By report sections
Collapse:
- Click 'CollapseAll' to collapse all categories.
When collapsed, a plussign
displays.
Expand:
- Click the plussign for a category to expand that category only.
- Click 'ExpandAll' to expand allcategories.
Filter column data
- Click the columnmenu (down arrow) in the columnheader and select 'Filter'. The filter properties for the column display in the left panel.
- Choose a filter display option that matches the type of data, such as check list, slider, text input, or calendar.
- The 'Moreoptions' menu has the 'Useasdisplayfilter' toggle. By default the table filter is applied to the database. Toggle this on to apply the filter to the datainmemory.
- Click 'Apply' to see the filter applied to the table.
Filter tips:
(See Filtering Data in Visualizer.)
- To change the filter, click the filtericon in the columnheader.
- To instantly filter a table: Drag-select a set of rows.
- Filters applied in the filter drill path display at the top. Hover to see the appliedfilters. Click a node to go to a previousstate.
- To toggle a filter off or delete it, click 'Filters' in ChartBuilder.
Hide/show columns
Hide: Click the columnmenu (down arrow) in the columnheader and select 'Hidecolumn'. While the column is no longer visible, it is still in Chart Builder and its name is grayed out. You will still see its information in a popup.
Show: To show a hidden column, click its grayed-out name in Chart Builder then click 'ShowColumn'.
Delete a column
Click the columnmenu (down arrow) in the columnheader and select 'Delete'.
Formatting data in a Visualizer table
Visualizer provides formatting options for data displayed in visualizations. You can format:
- Suffixes that represent magnitude, such as M for millions, to display in tooltips.
- Currency symbols for measure values to display in tooltips and axis labels.
- The number of decimal places to display in tooltips.
You can format currency symbols and decimal places for any measures, including:
- Measure type expressions created in Visualizer.
- Saved expressions created in Designer and listed as Other Expressions in the Subject Area.
- Custom measures created in the Admin module.
For other table formatting options, such as the default Grand Total for measures, see Create a New Table.
Formatting measure values
Create a table in Visualizer.
- Click Columns in ChartBuilder.
- Click DataFormatting for the column you want to change.
- Select the suffix to formatnumbers.
- Select the decimalprecision.
- Select a currencysymbol. This is for display only, it does not change the data.
- Apply data formatting to other columns.
- Click Save.